A new data-driven framework gives retailers the tools to identify what is happening in their stores in real-time and allows them to strategically react—before it’s too late
If 2020 taught us anything, it was to expect the unexpected. And, in the age of coronavirus, this has proven to be true as much in business as in public health.
After all, this was the year that saw millions of Canadians hoarding toilet paper and panic-buying pasta and canned beans as lockdowns and quarantines swept over the country in the early months of the pandemic.
Retailers are no strangers to sudden spikes in high-demand products, whether precipitated by rare natural events or the launch of a must-have gadget. They have long had systems in place to mitigate the impact of panic buying on customers and supply chains.
But no one was prepared for the scope and scale of disruption caused by COVID-19.
But no one was prepared for the scope and scale of disruption caused by COVID-19.
On the front lines, clerks at grocery stores, corner shops and pharmacies bore the brunt of angry and frightened customers as empty store shelves and online stockouts quickly became emblematic of the global panic incited by the pandemic. Retail businesses suffered short-term shocks to their bottom line and false demand signals prompted by a sudden rush on select essential goods added to an already strained and chaotic global supply chain.
Critically, the safety and welfare of vulnerable Canadians fell to an even greater risk level as toilet paper, soap, hand sanitizer, meat and rice grew increasingly scarce.
“In our conversations with many retailers, most of them were aware of the situation, but their actions tended to come too little, too late,” says Warut Khern-am-nuai, assistant professor of information systems at McGill University’s Desautels Faculty of Management.
Applied by anyone
With a new year, and new hope of containing the virus on the horizon, retailers are now eager to deconstruct the chaos of 2020 and ensure that similar shortages never happen again.
To that end, a team of Canadian researchers has helped develop a data-driven framework that takes the guesswork out of product distribution, even amid a pandemic. The research is the first to leverage data, statistical models, and machine-learning methods to not only detect potential panic-buying behaviour in real-time but also help retailers identify what is happening and allow them to strategically react—before it’s too late.
Notably, the research, which is publicly available for download, is designed to be easily scaled for a large number of product categories and stores.
“It works really well, and it can be applied by anyone,” says Maxime Cohen, associate professor of retail management and operations management, who co-authored the study with his Desautels colleague Warut Khern-am-nuai, an assistant professor of information systems, along with Yossiri Adulyasak from HEC Montréal, and Ahmed Chaouachi and Omar Benomar from IVADO Labs.
Their collective work draws from over 15 million point-of-sale data points supplied by one of the largest grocery chains in North America. While many businesses across the retail spectrum were impacted by panic buying, it was grocery stores that took the biggest hit early on. According to Statistics Canada, grocery stores’ sales were up 40 percent in mid-March 2020—as federal and provincial governments ordered lockdowns across the country—compared to the same period the previous year.
While many businesses across the retail spectrum were impacted by panic buying, it was grocery stores that took the biggest hit early on.
Researchers specifically examined the effect of COVID-19 on three key product categories: toilet paper (398 products), canned soup (255 products), and household cleaners (554 products). Sales in these product categories doubled—and in some cases tripled—beginning around mid-March, according to the retail data cited in the study.
To augment the prediction accuracy of their model, researchers also collected data from external sources related to the COVID-19 pandemic. Specifically, they looked at Twitter and Google Trend searches for the term “COVID-19” and those related to the product categories of the study.
In addition, they examined news articles from three local news outlets and collected all news articles that mentioned “COVID19” or one of the product categories.
Two-stage model
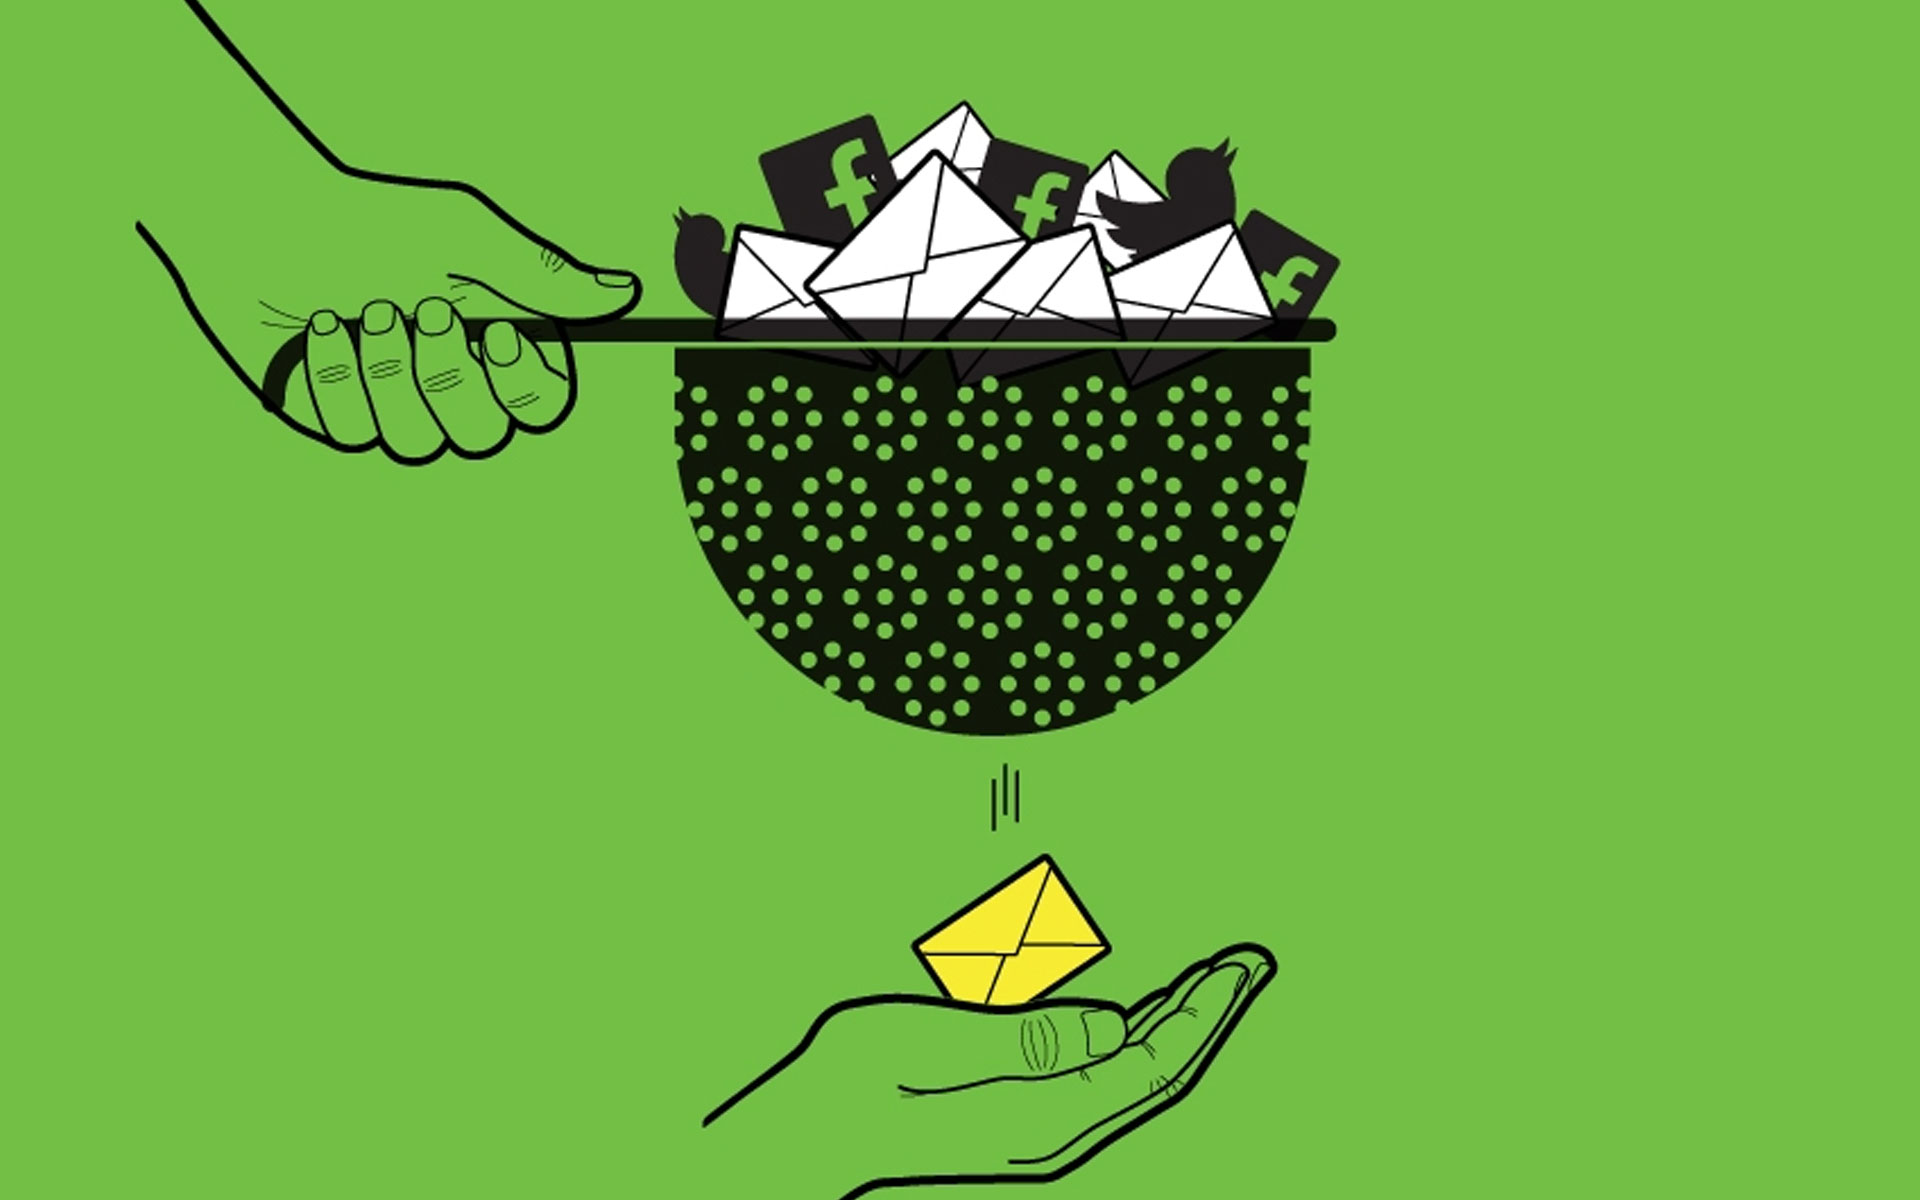
The research underscores the strength of a two-stage model. The first stage uses internal data to detect anomalies from a statistical perspective. By monitoring toilet paper sales, for instance, a retailer can easily spot a sudden spike in product demand.
Moreover, the second step allows for a more nuanced interpretation of what is happening by identifying the spike as either “pertinent” or “non-pertinent.”
“Not all anomalies are problematic,” the co-authors stated. “Let’s say that the store offers a fire sale on a specific product. Obviously, people will buy a lot and you will see a spike in demand. So, it’s not a pertinent anomaly because it is expected.”
On the other hand, a pertinent anomaly may show up as a sales spike that spreads to other stores, or triggers an unexpected stockout within a store or leads to other anomalies.
“For instance, you might see a lot of people who buy toilet paper within a five-minute period. You may not consider that an anomaly, but in the next five minutes you still see a spike, then again in the next five minutes,” say the co-authors.
The anomaly-detection model is designed to allow retailers to determine what they consider to be “pertinent,” and to classify the severity of each detected anomaly. Critically, it can provide the information quickly (within five minutes), giving retailers the opportunity to trigger immediate control mechanisms, such as setting customer purchase limits on items or ordering additional stock to avoid shortfalls.
Researchers acknowledge that getting external data from Twitter can be complicated for a small business that may not have dedicated social media staff. In such a case, they recommend using a platform like Google Trend, which, say the co-authors, “is extremely easy to use and you don’t need any technical background.”
The difference is worth the effort: The model without input from external sources is 60 percent accurate in predicting panic buying. By adding external sources, that figure rises to 85 percent.
Democratizing access
Besides the business impact, researchers say their framework has an important social function to play during panic-buying waves.
The study shows that the toilet paper crisis of last March could have been avoided had retailers imposed a limit of one item per customer starting March 12. Had retailers rationed toilet paper from March 12-19—the crux of the panic-buying period in North America—nearly 57 per cent more customers could have been served.
“At first glance, many may argue that this issue is not a big deal because in-demand products are naturally out-of-stock,” the co-authors stated.
“For the most part, people are able to compete in panic-buying just fine; however, some people, like the elderly or the disabled, are significantly disadvantaged in this situation and were not able to get essential products.”
For the research team, providing the ability for more people to get essential products in a time of need—at no additional cost to the retailer—is one of the biggest successes of the model.

Maxime Cohen
Associate Professor of Retail Management and Operations Management; Co-Director, Retail Innovation Lab

Warut Khern-am-nuai
Assistant Professor, Information Systems


